Welcome to Newsletter 17!
>>Click Here for this week’s Newsletter<<
In our newsletter you will be introduced to a STEM topic and find a related-activity to work on during the week (please share your results with us!), as well as extensions to additional learning or games related to the field. In addition, you will find a Northeastern connection – something Northeastern is doing related to that field. This week’s topic: Anatomy & Physiology. For a list of prior blog posts, see the blog index.
Resource Highlight
Like last week, here are two game sites for learning more about Anatomy & Physiology:
- Free Anatomy Quiz
This web site offers a range of free quizzes, to help people learn about anatomy and physiology. It offers clear, accurate practice questions on human anatomy, and while it’s aimed primarily at students of health related disciplines, it’s free for anyone to use. - Anatomy Arcade
The above site primarily has text-based quizzes. This website is more game-oriented, with flash games all about various body systems.
Web Resources for K-12 Students and Parents
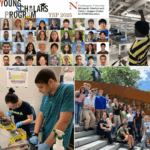
As the summer (2020) wraps up, I can’t help but reflect on what this past summer has looked like. Our Young Scholar’s Program (YSP) successfully went virtual, whilst our other summer programs (NUSSP, returning IFTP), unfortunately were unable to run. As the lead instructor for these programs which were unable to run, my summer felt a little hollow (although I really liked getting involved more with YSP). As such, for the next few weeks, I’ll be sharing some of the resources I would have used during these summer programs.
One of my hobbies is exploring the world, virtually (Google Earth) and in reality (traveling to strange/exciting places). Relatedly, I’ve found a variety of Earth exploration/analysis resources and tools, many of which I utilize during our summer programs and field trips. When teaching about Natural Disasters and Climate Change, I always start with this NYT article from 2018, as it really visualizes the impact of natural disasters on different regions of the USA. To show the impact of climate change and rising sea levels, I like to show the Mass.gov Sea Level Rise/Coastal Flooding Viewer, as well as NOAA’s National Sea level Rise Viewer.
I also like to expose students to the wonderful world of GIS (Geographic Information Systems) – i.e. visualization tools for geographic data. Most people are familiar with Google Maps and Google Earth (pro version is free to download!), and Google Street View, but not many have heard of MassGIS (Massachusetts’ Bureau of Geographic Information), which has some great tools and maps. I’m fond of OLIVER and MORIS, which are map sets for exploring land- and ocean-focused datasets, respectively.